Buy Break
source: Investopedia When a stock appears to have met resistance at the $50 price level for the last year. Many traders will watch the price movement around $50 very closely because a break above the resistance would suggest that a likely surge higher will follow. Technical traders use a break above resistance to signal a good opportunity to buy because a resulting surge of upward momentum commonly follows.
 |
| Gap Sampl |
Gapping
source: Investopedia To employ a gap strategy an investor can scan the morning prices for a gap and watch to see what the stock does in the first couple hours of the trading day. In general, if the price goes up, it signals a buy, and if it goes down, a short. There are several variations of the gap strategy.
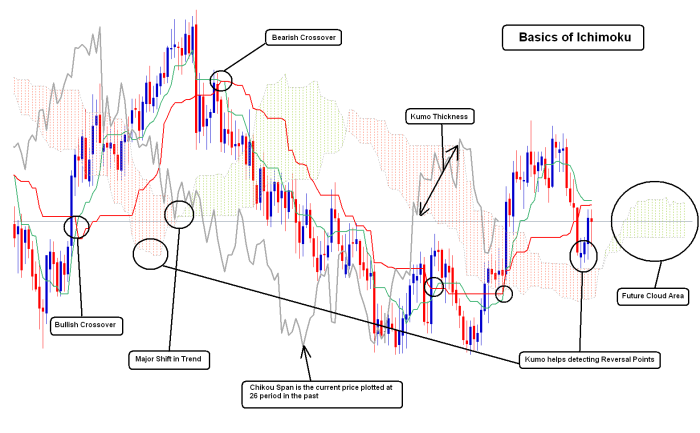
Ichimoku Kinko Hyo
source: Investopedia "Ichimoku" is a Japanese word that means "one look." This charting technique was created by a Japanese newspaper writer. It does look very complicated when a trader sees the indicator for the first time, the complexity quickly disappears once you gain an understanding of what the various lines mean and why they are used.
In my web search to learn more I came across a blog Introduction to Ichimoku. The blog writer has committed himself to helping others understand how to read these charts, a sample is show below. The blog also provides comments from other users of the chart. To read the blog or see the chart in more detail just click here.
 |
| Sample Ichimoku Kinko Hyo Chart |
No comments:
Post a Comment